Two Defensive Stats the NBA Needs
While talented offensive players are all the buzz in the NBA nowadays, defensive players will never go out of favor. Players who can shut down talented scorers, protect the rim or stick to shooters are always needed, and every championship-caliber team has multiple players who can fill these roles.
While certain players may be referred to as kings of the “little thing” or “hustle”, “energy”, and “glue” guys on the defensive side of the basketball, how amazing would it be if we could quantify exactly what makes these players so special on defense? I have been bothered by this question for a long time, and I have come up with two different statistical solutions to help solve this issue.
These are my two suggestions for defensive statistics that the NBA should adopt.
1. Stops
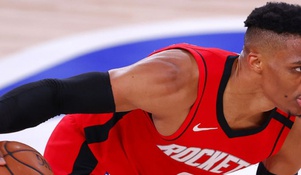
You are a Los Angeles Clippers fan, and your favorite team is playing against James Harden and the Rockets. There are 103.3 possessions in an average 2019-20 Rockets game, and because James Harden plays 36.7 minutes per game, Harden plays about 79 possessions per game. With a 36.4 usage percentage, Harden finishes about 29 possessions per game. If the Clippers can stop Harden from scoring on 15 of those possessions, there is a high likelihood the Clippers will win. Naturally, the Clippers will use Kawhi Leonard as their primary defender on Harden, and the eye test may tell us Leonard did a great job, regardless of whether or not he picked up any steals and blocks. However, a statistic that shows us exactly how good Leonard was at shutting down opponents would make Leonard’s dominance defensively quantifiable.
Enter statistic #1: Stops. I believe that stops are a missing statistic in the NBA, as a player who can shut down a player from scoring on half the possessions will be sought after by every NBA team. If a defender forces the offensive player into a missed shot or a turnover, he should be credited with a stop. With stops, we can see exactly how many times a player prevented his matchup from scoring.
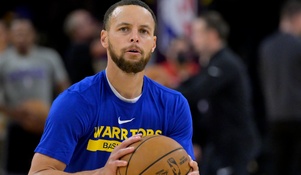
Remember: in the 2015 NBA Finals, the Golden State Warriors’ Stephen Curry averaged 26 points, 5.2 rebounds, 6.3 assists, and 1.8 steals per game. However, the Finals MVP was Curry’s teammate Andre Iguodala, who put up only 16.3 points, 5.8 rebounds, 4 assists, and 1.3 steals (shooting 10 of 28 from the free-throw line) but won FMVP because, as the primary defender on LeBron James, he held James to 39.8% shooting from the field and to 31% from beyond the arc. James may have averaged 35.8 points, 13.3 rebounds, 8.8 assists, and 1.3 steals a game, but with the low efficiency he had, Iguodala was able to garner stops on a high number of possessions for the Warriors, helping guarantee them the series.
While one can argue that this stat may favor defenders who guard weaker scorers, as those poor offensive players provide defenders a better chance for a stop, there are two responses to this. First, because the usage percentage of top offensive players is much higher, it provides many more stop opportunities, thereby negating the higher percentage for a stop by guarding those weaker offensively. Second, top defenders are usually guarding the top offensive players, which makes the chances a lot more equal, as the best defenders naturally have the toughest stop challenge, while the weaker defenders will have an easier chance to get a stop. These two reasons should make the playing field fairly even for all players across all positions and defensive levels. Because of these outside factors, the only reason a player should have a varying amount of stops is because of playing time or sheer defensive ability.
This stat can also lead to the creation of more comparable numbers: stops per game, stops per 36 minutes, stop percentage, and more.
2. Saved Blocks
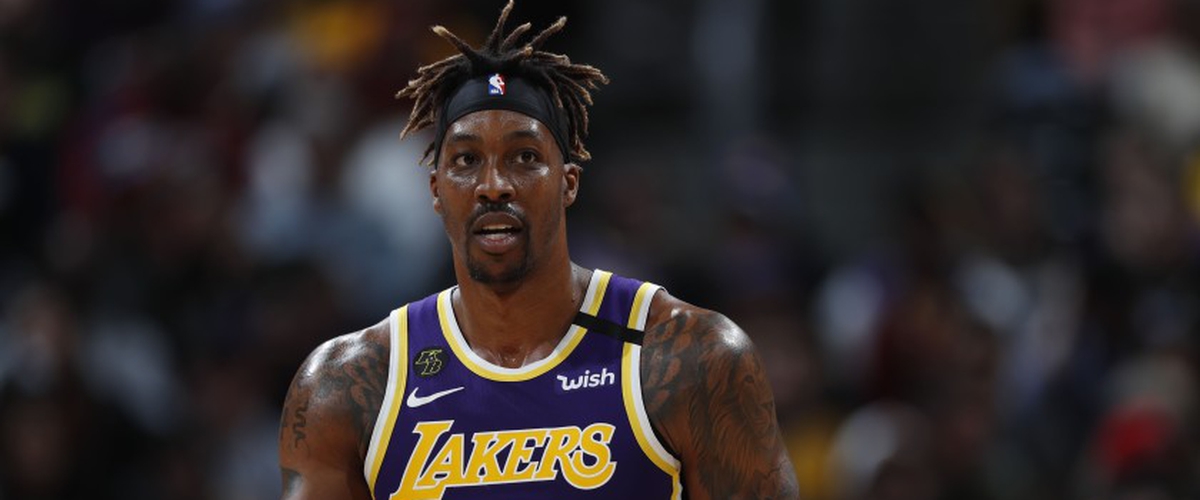
When Dwight Howard swats the ball out of bounds like a volleyball spike, fans everywhere get excited and hyped up- the way that he violently and mercilessly smacks the ball on defensive rotations is extremely embarrassing for opposing teams and a huge shift of momentum for his team. However the issue with these types of blocks is quite easy to see: while Howard is completely erasing that shot attempt, he is literally giving the ball right back to the other team for an extra attempt to score. In other words, his blocks are almost worth nothing, as the opposing team gets a free extra shot. His block is essentially the same as an offensive rebound, because, in both cases, the offensive team misses the shot, yet gets it right back.
If Howard were to either catch the ball mid-air (like we have seen from players such as Javale McGee or Hassan Whiteside) or tip it to a teammate, the block would be immensely more valuable. Simply put, this second type of block ends the possession for the offensive team, meaning that they did not score on this opportunity, and did not get another chance to do so, as opposed to the first type of block after which the offensive team gets another chance to score on this possession.
A better and more appropriate measure than blocked shots would be Saved Blocks, which counts only those blocks that are recovered by that defensive team to end the offense’s possession. “Saved Blocks” is a much more important stat than “Blocks”, because it takes out all the blocked shots that give the ball right back to the offense (and are essentially the same as an offensive rebound). While people can argue that those monstrous stuffs (that Howard has become synonymous with) are huge momentum shifters and may scare the offense into shooting less efficient shots, there is absolutely no way to statistically account for momentum, while there is a fairly easy way to account for who gets possession of the ball after the block.
Obviously, blocks are not the same as offensively rebounded shots because offensively rebounded shots are missed shots, while blocked shots could have been scored shots and are instead turned into misses. Furthermore, there is no reset shot clock for blocked shots as there are for offensively rebounded shots, which can put offensive teams in tough situations. However, the point still stands: non-saved blocks give the ball right back to the offensive team for another scoring opportunity, which just is not nearly as valuable as saved blocks.
Similar to stops, saved blocks can be broken down from just an overall number to saved blocks per game, saved blocks per 36 minutes, saved blocks percentage, and even more.